Returning production and experience can tell us a lot about how prepared a college football roster is entering a new season, but they miss perhaps the most important question: how good is that production actually? Just because a team returns a bunch of starters or brings back thousands of career snaps doesn't automatically make it good.
Experience without results is just experience.
Using data from TruMedia, CBS Sports compiled career FBS production for each player across all 138 rosters entering the 2026 season. Just as in last week's experience analysis, the data include only FBS production, which means newcomers North Dakota State and Sacramento State typically appear at or near the bottom of these rankings.
College football's most experienced teams: Ranking all 138 FBS rosters ahead of the 2026 season Cody Nagel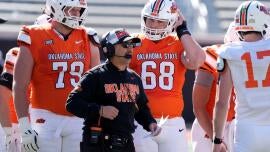
This breakdown goes beyond raw snaps to examine what that experience actually produced, from passing, rushing and receiving output to combined offensive efficiency and even offensive line performance. Next week, we'll flip the script and examine defensive production.
But first, which offenses actually bring back the most proven production entering 2026? Let's start at quarterback.
Passing production
TeamYds.Att. (Rank)Comp. (Rank)TD (Rank)1. Indiana12,3691,587 (2)1,001 (2)92 (1)2. UCF12,1531,635 (1)977 (3)92 (1)3. Arizona State10,7801,529 (3)1,016 (1)81 (3)4. Oregon10,2421,313 (5)885 (5)73 (4)5. Iowa State10,2321,487 (4)922 (4)55 (12)6. Penn State9,3741,186 (7)721 (8)64 (8)7. Arizona9,2041,215 (6)786 (6)73 (4)8. Nebraska8,7141,155 (8)728 (7)54 (14)9. Auburn8,4381,059 (11)685 (11)69 (6)10. USC8,250971 (18)613 (16)53 (18)11. Liberty8,1351,061 (10)587 (18)53 (18)12. SMU7,781972 (17)636 (12)56 (11)13. UTSA7,7241,074 (9)693 (9)65 (7)14. Boise State7,6711,005 (14)606 (17)54 (14)15. Florida Atlantic7,6001,033 (12)689 (10)57 (10)16. Wisconsin7,4601,003 (15)617 (14)52 (20)17. NC State7,019991 (16)629 (13)51 (21)18. Michigan State6,8741,011 (13)615 (15)37 (36)19. Miami6,784801 (27)529 (25)58 (9)20. Georgia Southern6,605942 (19)571 (20)54 (14)21. Utah6,579901 (22)538 (22)49 (22)22. Illinois6,531850 (23)532 (24)43 (28)23. Northwestern6,359917 (21)543 (21)41 (29)24. Tulane6,320934 (20)587 (18)54 (14)25. Oklahoma6,297772 (31)490 (28)47 (26)26. Syracuse6,214800 (28)492 (27)48 (24)27. Texas6,175827 (24)501 (26)55 (12)28. Cincinnati5,965820 (25)533 (23)39 (33)29. Duke5,698762 (32)436 (37)33 (41)30. Virginia5,685745 (33)478 (29)49 (22)31. Kansas State5,585784 (29)458 (31)48 (24)32. Texas A&M5,450668 (40)407 (43)41 (29)33. Oklahoma State5,441620 (48)412 (42)39 (33)34. Houston5,434731 (35)457 (32)44 (27)35. South Carolina5,385661 (41)415 (41)36 (38)36. Oregon State5,358817 (26)477 (30)39 (33)37. Mississippi State5,345783 (30)441 (36)41 (29)38. Washington5,117637 (45)431 (38)40 (32)39. Florida State4,995743 (34)450 (35)26 (53)40. California4,956722 (36)456 (33)28 (49)41. Ole Miss4,938601 (50)380 (47)26 (53)42. UCLA4,893710 (38)452 (34)34 (39)43. Wake Forest4,776634 (46)416 (40)31 (43)44. LSU4,690626 (47)387 (45)37 (36)45. Marshall4,685718 (37)425 (39)32 (42)46. Eastern Michigan4,419638 (43)382 (46)31 (43)47. BYU4,346603 (49)364 (50)21 (67)48. Texas Tech4,300638 (43)379 (48)30 (45)49. Baylor4,233538 (55)334 (55)28 (49)50. Southern Miss4,158655 (42)391 (44)26 (53)51. Maryland4,127684 (39)376 (49)25 (56)52. Delaware3,948536 (57)339 (53)25 (56)53. Troy3,944552 (53)333 (57)30 (45)54. Ohio State3,879442 (69)331 (59)34 (39)55. Charlotte3,828583 (51)337 (54)25 (56)56. Hawaii3,714502 (61)334 (55)30 (45)57. North Texas3,713513 (59)317 (61)20 (69)58. Georgia3,692499 (62)345 (52)28 (49)59. North Carolina3,615539 (54)333 (57)22 (65)60. Missouri State3,570538 (55)319 (60)28 (49)61. UNLV3,510582 (52)364 (50)25 (56)62. South Florida3,490503 (60)285 (65)22 (65)63. Texas State3,489389 (74)271 (66)23 (62)64. Tulsa3,442517 (58)287 (62)25 (56)65. App State3,155446 (67)226 (72)29 (48)66. East Carolina3,116416 (71)256 (69)21 (67)67. Louisiana Monroe3,099482 (63)268 (67)23 (62)68. South Alabama3,018436 (70)287 (62)17 (71)69. West Virginia3,001444 (68)256 (69)17 (71)70. Minnesota2,995458 (64)287 (62)23 (62)71. Purdue2,879454 (65)268 (67)13 (83)72. Notre Dame2,781298 (84)196 (81)24 (61)73. New Mexico2,574332 (80)217 (77)13 (83)74. Kennesaw State2,565450 (66)248 (71)12 (86)75. Missouri2,559397 (72)219 (75)16 (73)76. Pittsburgh2,461340 (77)210 (78)16 (73)77. Michigan2,444337 (78)204 (79)12 (86)78. San Diego State2,407319 (82)185 (83)16 (73)79. Western Kentucky2,373394 (73)219 (75)15 (76)80. Stanford2,265355 (76)221 (73)15 (76)81. Nevada2,239360 (75)220 (74)14 (79)82. Louisiana Tech2,181298 (84)190 (82)9 (91)83. Kent State2,157259 (87)146 (88)19 (70)84. Rutgers2,128303 (83)202 (80)14 (79)85. Colorado2,101323 (81)181 (85)14 (79)86. Louisiana2,081333 (79)183 (84)12 (86)87. Air Force1,868177 (95)103 (95)14 (79)88. Western Michigan1,841271 (86)171 (86)9 (91)89. Kansas1,606259 (87)170 (87)12 (86)90. Jacksonville State1,537213 (90)131 (90)9 (91)91. FIU1,517238 (89)146 (88)12 (86)92. Georgia State1,382203 (91)131 (90)13 (83)93. Florida1,365190 (92)102 (96)4 (112)94. Virginia Tech1,348182 (94)124 (92)8 (94)95. Utah State1,198172 (96)106 (94)15 (76)96. Arkansas State1,131163 (99)70 (103)3 (117)97. Rice1,079188 (93)109 (93)7 (96)98. Middle Tennessee1,053148 (100)84 (100)7 (96)99. Old Dominion998164 (98)101 (97)6 (100)100. Colorado State920137 (102)86 (99)6 (100)101. San Jose State857168 (97)93 (98)6 (100)102. Sam Houston807145 (101)73 (101)4 (112)103. Arkansas78093 (112)58 (109)5 (104)104. Central Michigan747118 (104)69 (105)5 (104)105. Tennessee741109 (106)60 (108)4 (112)106. UAB726103 (108)65 (106)7 (96)107. New Mexico State717104 (107)70 (103)5 (104)108. Toledo69997 (110)63 (107)7 (96)109. Army69487 (114)47 (114)4 (112)110. UConn69292 (113)54 (111)5 (104)111. Clemson661119 (103)72 (102)5 (104)112. Iowa65577 (117)49 (112)8 (94)113. UMass63074 (118)43 (117)2 (120)114. Bowling Green58480 (116)45 (115)5 (104)115. Miami (Ohio)57587 (114)38 (118)4 (112)116. Northern Illinois566118 (104)55 (110)5 (104)117. Navy51698 (109)44 (116)3 (117)118. Alabama41051 (122)38 (118)5 (104)119. Georgia Tech37626 (128)20 (127)6 (100)120. Sacramento State35595 (111)48 (113)1 (125)121. Vanderbilt34954 (121)26 (121)2 (120)122. Coastal Carolina34749 (123)24 (124)3 (117)123. Ohio29057 (119)26 (121)2 (120)124. Kentucky27756 (120)33 (120)0 (130)125. Louisville25036 (125)21 (126)1 (125)126. Wyoming22545 (124)26 (121)1 (125)127. Akron15633 (126)23 (125)0 (130)128. Fresno State14426 (128)15 (128)1 (125)129. James Madison11319 (130)10 (130)1 (125)130. Washington State11119 (130)9 (131)2 (120)131. UTEP9327 (127)15 (128)2 (120)132. Memphis696 (133)4 (132)0 (130)133. Ball State3712 (132)4 (132)0 (130)134. Temple232 (134)2 (134)0 (130)135. Boston College00 (135)0 (135)0 (130)135. Buffalo00 (135)0 (135)0 (130)135. North Dakota State00 (135)0 (135)0 (130)135. TCU00 (135)0 (135)0 (130)Note: Texas Tech's production excludes Brendan Sorsby due to ongoing uncertainty surrounding his availability for the 2026 season.
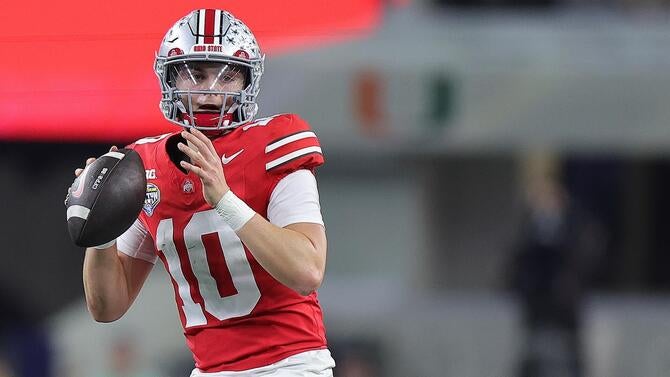
What quarterback wouldn't want to play for Curt Cignetti at Indiana if given the opportunity? After Kurtis Rourke and Heisman Trophy winner Fernando Mendoza both delivered record-setting seasons in their lone years in Bloomington, the Hoosiers once again turned to the transfer portal to reload at the position, identifying former TCU standout Josh Hoover as the next man up.
No returning quarterback in the FBS has thrown for more career yards passing than Hoover (9,629). He's also second in passing touchdowns (70) and third in attempts (1,185). That experience and production should help soften the drop-off after Mendoza departed as the No. 1 overall pick in the 2026 NFL Draft. However, as the saying goes, a team is only as good as its backup quarterback.
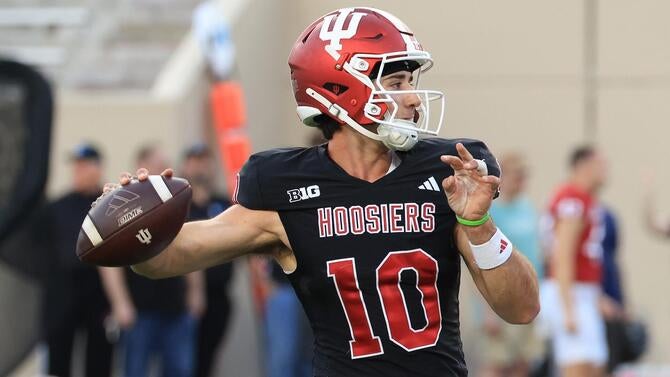 Reigning national champion Indiana added Josh Hoover, one of the country's most experienced quarterbacks, via the transfer portal. Getty Images
 The talent gap between Hoover and backup Grant Wilson is substantial, but Indiana is one of only four programs in the country with two quarterbacks on the roster who have at least 13 career FBS starts, joining Oregon, UCF and Wisconsin.
Then there are four programs entering 2026 without a quarterback on the roster who has attempted a single pass at the FBS level. That group includes Boston College, which turned to Division II Saginaw Valley State transfer Mason McKenzie, and TCU, which landed former Harvard quarterback Jaden Craig to lead its offense. Both arrive with strong production at their previous stops, but neither brings any FBS experience.
Still, just because a team has a quarterback room with high-volume passing numbers doesn't necessarily mean it's the most efficient.
Passing efficiency
Minimum thresholds: Teams with ≥50 dropbacks in FBS Teams ordered by average FBS ranking across the six stats
TeamComp%Yd/AttAY/AttTD%INT%Sack%1. Notre Dame65.8% (16)9.3 (2)10.0 (16)8.1% (4)2.0% (33)2.6% (3)2. Miami66.0% (14)8.5 (9)9.5 (26)7.2% (8)1.5% (16)5.4% (35)3. Ohio St.74.9% (1)8.8 (4)7.9 (91)7.7% (6)1.8% (28)4.5% (23)4. Toledo64.9% (22)7.2 (57)9.9 (19)7.2% (9)1.0% (8)5.8% (48)5. Hawaii66.5% (11)7.4 (45)8.9 (45)6.0% (27)1.8% (25)4.9% (27)6. Alabama74.5% (2)8.0 (16)6.0 (124)9.8% (2)0.0% (1)5.6% (40)7. Oklahoma St.66.5% (12)8.8 (5)8.2 (78)6.3% (16)2.1% (36)5.5% (39)8. Arkansas62.4% (48)8.4 (10)8.3 (72)5.4% (44)1.1% (9)3.1% (11)9. Utah59.7% (77)7.3 (49)10.4 (10)5.4% (40)1.9% (30)2.9% (7)10. USC63.1% (36)8.5 (8)9.1 (35)5.5% (38)3.1% (90)3.0% (8)11. Auburn64.7% (24)8.0 (20)9.6 (24)6.5% (13)2.3% (46)8.0% (94)12. Delaware63.2% (33)7.4 (46)9.2 (34)4.7% (70)1.5% (14)5.0% (28)13. Ole Miss63.2% (34)8.2 (12)8.5 (66)4.3% (82)1.7% (18)3.7% (14)14. Kent St.56.4% (99)8.3 (11)9.8 (22)7.3% (7)1.2% (12)6.8% (76)15. Texas A&M60.9% (64)8.2 (13)9.1 (36)6.1% (19)2.8% (77)4.3% (20)16. Texas St.69.7% (3)9.0 (3)8.4 (69)5.9% (28)2.3% (49)7.2% (82)17. Arizona64.7% (23)7.6 (31)8.2 (79)6.0% (25)2.0% (32)5.7% (45)18. Georgia St.64.5% (25)6.8 (81)7.4 (108)6.4% (15)1.0% (7)2.9% (5)19. Illinois62.6% (45)7.7 (27)9.1 (39)5.1% (52)2.6% (58)4.5% (22)20. SMU65.4% (19)8.0 (18)7.8 (94)5.8% (32)2.7% (63)4.2% (19)21. Penn St.60.8% (66)7.9 (21)8.6 (55)5.4% (43)2.3% (47)4.2% (17)22. Wake Forest65.6% (18)7.5 (34)8.5 (64)4.9% (58)1.9% (31)5.8% (46)23. Houston62.5% (47)7.4 (41)8.6 (59)6.0% (24)2.2% (42)5.6% (40)24. Georgia69.1% (4)7.4 (44)6.7 (121)5.6% (35)1.8% (27)5.1% (29)25. Indiana63.1% (39)7.8 (24)9.1 (37)5.8% (30)2.8% (74)6.3% (59)25. Kansas St.58.4% (87)7.1 (61)8.7 (52)6.1% (20)2.2% (39)2.9% (4)27. LSU61.8% (52)7.5 (36)8.6 (61)5.9% (29)1.8% (24)6.4% (62)28. Boise St.60.3% (74)7.6 (29)8.8 (49)5.4% (45)2.3% (48)4.5% (21)29. Oklahoma63.5% (31)8.2 (14)8.6 (60)6.1% (22)2.5% (56)7.4% (86)30. Iowa63.6% (30)8.5 (7)7.3 (114)10.4% (1)5.2% (121)0.0% (1)31. Duke57.2% (96)7.5 (38)11.4 (5)4.3% (81)2.6% (59)1.3% (2)32. Washington67.7% (6)8.0 (17)8.0 (87)6.3% (17)2.2% (44)10.2% (113)33. UTSA64.5% (26)7.2 (58)7.3 (113)6.1% (23)2.0% (34)5.5% (38)34. Florida Atlantic66.7% (9)7.4 (47)7.3 (111)5.5% (37)2.7% (68)4.9% (26)35. Texas60.6% (68)7.5 (39)9.2 (32)6.7% (11)2.9% (79)6.8% (72)36. Rutgers66.7% (10)7.0 (68)7.4 (107)4.6% (72)1.7% (17)5.3% (31)37. Oregon67.4% (7)7.8 (23)7.7 (97)5.6% (36)2.7% (71)7.2% (84)38. Virginia64.2% (27)7.6 (30)8.1 (83)6.6% (12)3.1% (87)7.1% (80)39. Air Force58.2% (89)10.6 (1)12.5 (3)7.9% (5)5.6% (122)8.3% (101)40. Mid. Tennessee56.8% (97)7.1 (62)10.1 (14)4.7% (66)0.0% (1)7.5% (87)41. Wisconsin61.5% (59)7.4 (40)9.9 (21)5.2% (50)2.7% (66)8.0% (93)42. UCLA63.7% (29)6.9 (77)8.9 (43)4.8% (62)1.7% (20)8.4% (102)43. Baylor62.1% (50)7.9 (22)8.8 (46)5.2% (48)4.3% (115)6.3% (55)43. Liberty55.3% (107)7.7 (28)10.4 (9)5.0% (57)3.0% (83)6.2% (52)43. UCF59.8% (76)7.4 (42)8.7 (51)5.6% (34)2.4% (50)7.2% (83)46. Army54.0% (113)8.0 (19)12.9 (2)4.6% (73)3.4% (97)5.4% (36)46. FIU61.3% (62)6.4 (103)7.7 (99)5.0% (54)0.8% (6)4.0% (16)48. Ga. Southern60.6% (67)7.0 (69)8.1 (84)5.7% (33)1.5% (13)6.8% (75)49. Syracuse61.5% (61)7.8 (25)8.5 (62)6.0% (26)3.0% (81)7.5% (89)50. Texas Tech59.4% (79)6.7 (87)9.9 (20)4.7% (68)2.8% (75)4.2% (18)51. Arizona St.66.4% (13)7.1 (66)7.5 (102)5.3% (46)2.9% (78)5.6% (44)52. BYU60.4% (72)7.2 (56)8.5 (63)3.5% (112)1.5% (14)5.3% (33)53. Miss. St.56.3% (100)6.8 (80)9.4 (28)5.2% (47)2.7% (64)5.3% (32)54. NC State63.5% (32)7.1 (63)7.9 (92)5.1% (51)2.7% (69)5.8% (47)55. Nebraska63.0% (40)7.5 (33)8.6 (58)4.7% (69)2.7% (65)7.6% (91)56. E. Michigan59.9% (75)6.9 (74)8.5 (68)4.9% (59)2.8% (75)2.9% (6)57. UAB63.1% (37)7.0 (67)10.2 (13)6.8% (10)5.8% (123)9.6% (108)58. South Carolina62.8% (42)8.1 (15)8.5 (67)5.4% (39)3.0% (85)10.4% (114)59. Miami (Ohio)43.7% (123)6.6 (93)14.0 (1)4.6% (73)1.1% (11)6.5% (63)60. East Carolina61.5% (58)7.5 (37)8.8 (47)5.0% (53)2.4% (51)11.5% (119)61. Cincinnati65.0% (21)7.3 (51)7.4 (105)4.8% (65)2.4% (54)6.8% (73)62. Coastal Carolina49.0% (118)7.1 (64)8.2 (77)6.1% (20)0.0% (1)7.5% (90)63. North Carolina61.8% (54)6.7 (90)8.7 (53)4.1% (90)2.4% (52)5.4% (37)63. Utah St.61.6% (56)7.0 (70)9.6 (25)8.7% (3)4.7% (118)9.0% (104)65. New Mexico St.67.3% (8)6.9 (76)8.3 (70)4.8% (61)3.8% (107)6.3% (58)65. Troy60.3% (73)7.1 (60)8.8 (48)5.4% (41)2.2% (40)11.4% (118)65. Tulsa55.5% (105)6.7 (91)10.0 (17)4.8% (60)2.1% (38)6.7% (69)68. Minnesota62.7% (44)6.5 (96)7.8 (93)5.0% (55)1.7% (22)6.7% (71)68. UConn58.7% (85)7.5 (35)7.4 (110)5.4% (41)0.0% (1)9.8% (109)70. North Texas61.8% (53)7.2 (54)8.1 (82)3.9% (95)2.7% (70)5.4% (34)70. Oregon St.58.4% (88)6.6 (95)9.1 (38)4.8% (63)3.2% (92)3.2% (12)72. Iowa St.62.0% (51)6.9 (78)9.0 (41)3.7% (102)2.4% (53)6.7% (70)73. South Alabama65.8% (15)6.9 (75)6.7 (119)3.9% (94)2.1% (35)6.6% (66)74. Michigan60.5% (70)7.3 (52)8.5 (65)3.6% (109)2.7% (61)6.1% (49)75. Missouri St.59.3% (80)6.6 (92)8.9 (44)5.2% (48)3.5% (101)5.6% (43)76. San Diego St.58.0% (91)7.5 (32)9.8 (23)5.0% (56)3.4% (97)9.9% (110)77. App State50.7% (115)7.1 (65)10.3 (12)6.5% (14)3.1% (91)10.4% (115)77. California63.2% (35)6.9 (79)7.7 (98)3.9% (97)1.8% (26)6.8% (77)77. New Mexico65.4% (20)7.8 (26)8.0 (86)3.9% (93)3.0% (82)9.0% (105)80. UMass58.1% (90)8.5 (6)10.8 (8)2.7% (118)2.7% (67)18.7% (124)80. Virginia Tech68.1% (5)7.4 (43)6.7 (120)4.4% (77)2.7% (72)8.1% (96)82. W. Michigan63.1% (38)6.8 (84)7.3 (116)3.3% (113)1.1% (10)6.2% (53)83. Pittsburgh61.8% (55)7.2 (53)8.3 (75)4.7% (67)2.6% (60)9.6% (106)84. Florida53.7% (114)7.2 (59)10.4 (11)2.1% (121)3.7% (105)3.1% (9)85. Jax State61.5% (60)7.2 (55)7.8 (95)4.2% (87)1.9% (29)8.2% (100)86. Missouri55.2% (108)6.4 (100)9.5 (27)4.0% (91)3.0% (84)4.8% (25)87. South Florida56.7% (98)6.9 (72)9.4 (30)4.4% (79)2.2% (41)11.9% (120)88. Vanderbilt48.1% (119)6.5 (99)11.3 (6)3.7% (101)3.7% (106)3.6% (13)89. Tulane62.8% (41)6.8 (85)7.6 (100)5.8% (31)4.0% (110)6.9% (78)90. Northwestern59.2% (81)6.9 (73)9.3 (31)4.5% (75)3.3% (93)8.1% (98)91. Northern Illinois46.6% (120)4.8 (123)9.4 (29)4.2% (85)2.5% (57)5.6% (42)92. Maryland55.0% (111)6.0 (111)8.2 (76)3.7% (106)2.2% (43)3.8% (15)93. La. Tech63.8% (28)7.3 (48)6.5 (122)3.0% (115)3.4% (94)6.3% (56)94. Stanford62.3% (49)6.4 (102)7.4 (109)4.2% (87)3.4% (95)4.6% (24)95. La. Monroe55.6% (103)6.4 (101)10.9 (7)4.8% (64)4.1% (111)7.1% (81)96. Clemson60.5% (71)5.6 (117)6.9 (118)4.2% (89)1.7% (19)6.3% (57)97. Florida St.60.6% (69)6.7 (88)9.0 (40)3.5% (111)3.0% (80)7.4% (85)98. Charlotte57.8% (93)6.6 (94)8.6 (57)4.3% (84)3.1% (88)6.4% (61)99. Kansas65.6% (17)6.2 (109)7.5 (101)4.6% (71)3.1% (89)7.8% (92)100. Sac. State50.5% (116)3.7 (124)8.3 (71)1.1% (123)2.1% (37)3.1% (9)101. Marshall59.2% (82)6.5 (97)8.1 (81)4.5% (76)3.5% (99)6.1% (50)102. Kentucky58.9% (84)4.9 (122)7.9 (89)0.0% (124)0.0% (1)6.7% (67)103. Bowling Green56.3% (101)7.3 (50)6.4 (123)6.3% (18)5.0% (119)7.0% (79)104. UNLV62.5% (46)6.0 (112)7.3 (115)4.3% (83)1.7% (21)11.3% (117)105. Colorado St.62.8% (43)6.7 (89)7.2 (117)4.4% (78)5.1% (120)6.2% (51)106. Old Dominion61.6% (57)6.1 (110)7.5 (104)3.7% (105)2.4% (54)6.8% (73)107. Sam Houston50.3% (117)5.6 (116)10.0 (18)2.8% (117)2.8% (73)6.5% (63)108. Michigan St.60.8% (65)6.8 (82)7.5 (103)3.7% (104)2.7% (61)8.1% (97)109. Louisiana55.0% (112)6.2 (107)10.0 (15)3.6% (107)3.9% (109)6.5% (65)110. Ohio45.6% (121)5.1 (120)8.7 (50)3.5% (110)1.8% (23)8.1% (95)111. Wyoming57.8% (94)5.0 (121)9.2 (33)2.2% (120)2.2% (45)10.0% (111)112. Southern Miss59.7% (78)6.3 (104)7.3 (112)4.0% (92)4.3% (114)5.2% (30)113. Colorado56.0% (102)6.5 (98)8.7 (54)4.3% (80)3.4% (96)8.8% (103)114. Purdue59.0% (83)6.3 (105)8.3 (73)2.9% (116)3.5% (100)6.4% (60)115. C. Michigan58.5% (86)6.3 (106)8.9 (42)4.2% (85)4.2% (113)11.9% (121)116. Nevada61.1% (63)6.2 (108)8.1 (85)3.9% (96)3.9% (108)8.2% (99)117. Arkansas St.42.9% (124)6.9 (71)11.7 (4)1.8% (122)4.3% (116)18.1% (123)118. West Virginia57.7% (95)6.8 (86)8.3 (74)3.8% (98)3.6% (103)10.1% (112)119. Tennessee55.0% (110)6.8 (83)8.6 (56)3.7% (103)3.7% (104)10.7% (116)120. W. Kentucky55.6% (104)6.0 (113)8.0 (87)3.8% (99)3.6% (102)7.5% (88)121. Kennesaw St.55.1% (109)5.7 (115)7.9 (90)2.7% (119)4.4% (117)6.3% (54)122. San Jose St.55.4% (106)5.1 (119)7.4 (106)3.6% (108)4.2% (112)6.7% (67)123. Rice58.0% (92)5.7 (114)7.8 (96)3.7% (100)6.4% (124)9.6% (107)124. Navy44.9% (122)5.3 (118)8.1 (80)3.1% (114)3.1% (86)14.8% (122)There's no perfect way to determine quarterback efficiency. Some evaluators will place more weight on certain stats than others. Rather than relying on a single metric, this analysis incorporates a handful of commonly used quarterback stats to build a more complete picture of efficiency, ranks teams against the rest of the qualified FBS teams, and then averages those results.
Notice which teams are at the top?
Notre Dame, with this year's early preseason Heisman Trophy favorite CJ Carr. Miami with prized transfer portal quarterback Darian Mensah. And Ohio State with returning Heisman Trophy finalist Julian Sayin.
That trio is widely viewed as having some of the best quarterback rooms in the country, and the numbers largely back that up.
Among the 186 returning quarterbacks with at least 50 career dropbacks in the FBS, Carr ranks fifth in yards per attempt (9.2), sixth in touchdown rate (8.1%) and eighth in lowest sack rate (2.6%). Sayin, meanwhile, holds the highest completion rate (75.7%), is fifth in touchdown rate (8.2%) and ranks seventh in yards per attempt (9.1).
Mensah doesn't quite match the top-tier marks of the other two, but he still grades out well, ranking 15th in touchdown rate (7.1%), 18th in yards per attempt (8.4%), 18th in completion rate (66.3%) and 26th in interception rate (1.5%).
Where does Indiana fit with its nation-leading returning production? The Hoosiers rank 25th in a tier that includes other national championship contenders, such as Georgia (24th), Texas (35th), and Oregon (37th).
For Indiana, interception rate and sack rate drag down the overall average. The Hoover-Wilson tandem is tied for the most career interceptions among active quarterback rooms (44) and tied for second-most sacks taken (107). While that's a product of nearly 1,800 combined career dropbacks, they are also areas Curt Cignetti and staff will need to clean up if they want to make another deep playoff run.
The Longhorns' placement in these rankings largely mirrors the story of Arch Manning's first 15 career starts: the flashes are undeniable -- he ranks 17th in touchdown rate (7.0%) -- but inconsistencies in completion rate (77th; 62.1%) and sack rate (63rd; 5.5%), along with uneven production from journeyman transfer MJ Morris, prevent Texas from climbing higher.
Gunner Stockton, who is almost solely responsible for Georgia's placement in these rankings, isn't going to wow anyone with aggressive downfield passing, but the efficiency profile reflects a steady, mistake-averse approach. He ranks sixth in completion rate (69.5%) and 24th in interception rate (1.5%), while posting the third-lowest "Whoopsy Daisy Rate" (1.2%) among active FBS quarterbacks. The tradeoff is that Stockton has the ninth-lowest air yards per attempt (6.6) among the 186 qualified quarterbacks.
Oregon is an interesting case study because, again, the Ducks are one of only four teams with two quarterbacks who have at least 13 career starts each. Both Dante Moore and Dylan Raiola individually rank inside the top 25 in completion rate, but sit in the bottom half of qualified quarterbacks in air yards per attempt.
Miami isn't the only program near the top of these rankings leaning on a transfer quarterback. Oklahoma State (seventh) and Auburn (11th) also crack the top 12, thanks largely to the additions of Drew Mestemaker and Byrum Brown, respectively, who followed their head coaches to the Power Four level.
The Cowboys seem to have found a quarterback they can build around in Mestemaker. The former North Texas standout ranks fourth in yards per attempt (9.5) while also placing 10th in completion rate (68.5%) and 16th in touchdown rate (7.0%).
Brown has drawn criticism for his unconventional, wind-up throwing motion, but the production has been difficult to argue with. He ranks 27th in touchdown rate (6.4%), 30th in yards per attempt (8.1), 32nd in completion rate (64.9%) and 40th in air yards per attempt (9.6).
In fact, only three returning quarterbacks rank inside the top 40 in all four categories: Carr, Brown and Appalachian State's Malachi Singleton, who spent last season at Purdue and was previously at Arkansas.
 Ohio State quarterback Julian Sayin led the FBS in completion percentage a season ago. Getty Images
 Rushing production
Minimum thresholds: Yards/Attempt and Explosive Rush % (teams with ≥70 rush attempts AND ≥50 RB rush attempts in the FBS)
TeamYds.Att.Yd/AttTDExpl. RshExplRsh%1. Auburn7,0211,412 (2)5.0 (34)77 (1)164 (1)11.6% (28)2. Liberty6,3071,414 (1)4.5 (73)49 (8)145 (2)10.3% (57)3. Utah6,171962 (11)6.4 (3)73 (2)139 (3)14.4% (4)4. Michigan State5,7941,271 (3)4.6 (66)47 (11)125 (5)9.8% (69)5. Wisconsin5,3291,146 (5)4.7 (58)48 (10)126 (4)11.0% (41)6. UNLV5,2461,115 (6)4.7 (56)56 (3)125 (5)11.2% (34)7. Western Michigan5,0691,010 (9)5.0 (28)54 (4)99 (14)9.8% (70)8. Florida State4,9771,036 (7)4.8 (49)30 (41)117 (7)11.3% (32)9. Northwestern4,9611,167 (4)4.3 (83)54 (4)105 (9)9.0% (90)10. Virginia4,8671,025 (8)4.7 (52)49 (8)112 (8)10.9% (43)11. Houston4,7941,004 (10)4.8 (50)38 (25)104 (10)10.4% (53)12. Florida4,540866 (15)5.2 (14)39 (24)94 (16)10.9% (45)13. UCLA4,472865 (16)5.2 (18)34 (34)104 (10)12.0% (21)14. Missouri4,409807 (23)5.5 (10)42 (18)87 (21)10.8% (47)15. Georgia4,362933 (12)4.7 (57)51 (7)83 (26)8.9% (94)16. Oklahoma State4,324755 (28)5.7 (7)53 (6)102 (12)13.5% (7)17. San Diego State4,264860 (18)5.0 (37)41 (20)83 (26)9.7% (75)18. Tulsa4,177850 (19)4.9 (40)41 (20)85 (24)10.0% (65)19. Tulane4,133899 (13)4.6 (63)30 (41)93 (17)10.3% (55)20. Miami4,068882 (14)4.6 (61)47 (11)90 (19)10.2% (60)21. Texas3,953807 (23)4.9 (41)38 (25)100 (13)12.4% (16)22. Texas Tech3,870737 (29)5.3 (13)35 (30)95 (15)12.9% (10)23. BYU3,864818 (22)4.7 (54)44 (14)93 (17)11.4% (31)24. Minnesota3,655729 (30)5.0 (31)32 (37)68 (39)9.3% (82)25. Kansas3,646722 (31)5.0 (24)24 (59)86 (23)11.9% (23)26. LSU3,636785 (26)4.6 (60)28 (45)76 (29)9.7% (74)27. Louisville3,612523 (57)6.9 (1)35 (30)87 (21)16.6% (1)28. Kansas State3,603694 (32)5.2 (15)38 (25)89 (20)12.8% (12)29. Illinois3,571861 (17)4.1 (89)42 (18)66 (41)7.7% (114)30. Indiana3,480834 (21)4.2 (86)43 (17)85 (24)10.2% (61)31. Cincinnati3,406846 (20)4.0 (97)30 (41)77 (28)9.1% (88)32. Oklahoma3,312779 (27)4.3 (81)44 (14)71 (34)9.1% (87)33. Ole Miss3,283679 (37)4.8 (46)40 (23)70 (36)10.3% (56)34. Boise State3,156694 (32)4.5 (67)41 (20)62 (46)8.9% (91)35. Penn State3,064786 (25)3.9 (106)45 (13)56 (55)7.1% (119)36. Georgia Tech3,040458 (72)6.6 (2)35 (30)59 (52)12.9% (11)37. Rutgers2,938657 (41)4.5 (72)34 (34)73 (31)11.1% (39)38. Virginia Tech2,901588 (48)4.9 (38)25 (54)64 (42)10.9% (44)39. Texas State2,858567 (49)5.0 (27)32 (37)72 (33)12.7% (14)40. West Virginia2,809670 (38)4.2 (84)30 (41)74 (30)11.0% (40)41. UTSA2,733602 (46)4.5 (69)27 (47)69 (38)11.5% (30)42. South Carolina2,727694 (32)3.9 (101)31 (39)73 (31)10.5% (51)43. Texas A&M2,717557 (50)4.9 (42)28 (45)62 (46)11.1% (38)44. App State2,697669 (39)4.0 (96)25 (54)64 (42)9.6% (80)45. SMU2,659693 (35)3.8 (110)37 (29)57 (53)8.2% (108)46. Rice2,649551 (53)4.8 (48)18 (75)56 (55)10.2% (62)47. Duke2,647496 (63)5.3 (11)25 (54)60 (50)12.1% (20)48. Vanderbilt2,644533 (55)5.0 (36)35 (30)46 (69)8.6% (102)49. Kentucky2,631595 (47)4.4 (74)21 (67)53 (58)8.9% (93)50. UAB2,557513 (58)5.0 (33)13 (97)61 (48)11.9% (24)51. Air Force2,552542 (54)4.7 (55)26 (49)39 (85)7.2% (117)52. Arkansas State2,537661 (40)3.8 (109)22 (63)60 (50)9.1% (89)53. Baylor2,508607 (45)4.1 (90)16 (84)49 (63)8.1% (109)54. Washington2,496609 (44)4.1 (91)20 (71)71 (34)11.7% (27)55. Eastern Michigan2,402479 (65)5.0 (30)33 (36)56 (55)11.7% (26)56. Mississippi State2,382476 (67)5.0 (32)31 (39)64 (42)13.4% (9)57. Fresno State2,375459 (71)5.2 (17)18 (75)47 (66)10.2% (58)58. Tennessee2,371488 (64)4.9 (43)26 (49)52 (61)10.7% (50)59. Iowa State2,326653 (42)3.6 (117)21 (67)70 (36)10.7% (48)60. Ohio2,304479 (65)4.8 (47)27 (47)41 (80)8.6% (103)61. UCF2,293692 (36)3.3 (119)44 (14)61 (48)8.8% (97)62. North Texas2,273458 (72)5.0 (35)25 (54)64 (42)14.0% (5)63. Colorado State2,263385 (87)5.9 (5)18 (75)46 (69)11.9% (22)64. Ohio State2,254466 (70)4.8 (45)17 (81)52 (61)11.2% (36)65. Army2,243524 (56)4.3 (79)24 (59)26 (108)5.0% (132)66. Arizona2,208621 (43)3.6 (118)21 (67)53 (58)8.5% (104)67. Michigan2,194435 (77)5.0 (26)25 (54)41 (80)9.4% (81)68. Boston College2,155416 (82)5.2 (16)22 (63)40 (82)9.6% (76)69. Delaware2,065511 (59)4.0 (95)21 (67)49 (63)9.6% (77)70. NC State2,057557 (50)3.7 (114)38 (25)57 (53)10.2% (59)71. USC2,040404 (83)5.0 (25)26 (49)48 (65)11.9% (25)72. Temple2,031419 (80)4.8 (44)14 (92)27 (105)6.4% (122)73. East Carolina2,021498 (60)4.1 (93)17 (81)40 (82)8.0% (111)74. UConn2,016402 (84)5.0 (29)11 (108)45 (71)11.2% (35)75. Purdue2,006471 (68)4.3 (80)15 (89)43 (74)9.1% (86)76. Oregon1,997553 (52)3.6 (116)26 (49)53 (58)9.6% (78)77. Arkansas1,977376 (92)5.3 (12)23 (62)36 (93)9.6% (79)78. Nebraska1,938497 (61)3.9 (105)26 (49)67 (40)13.5% (8)79. Western Kentucky1,904434 (78)4.4 (75)22 (63)38 (87)8.8% (98)80. Iowa1,901376 (92)5.1 (22)15 (89)35 (94)9.3% (83)81. Sam Houston1,877419 (80)4.5 (71)22 (63)42 (77)10.0% (64)82. Jacksonville State1,863361 (100)5.2 (19)16 (84)44 (73)12.2% (18)83. North Carolina1,847470 (69)3.9 (100)24 (59)39 (85)8.3% (106)84. South Alabama1,827402 (84)4.5 (68)20 (71)43 (74)10.7% (49)85. Old Dominion1,820330 (103)5.5 (8)13 (97)42 (77)12.7% (13)86. Clemson1,787302 (109)5.9 (4)13 (97)45 (71)14.9% (3)87. Marshall1,777454 (74)3.9 (103)17 (81)47 (66)10.4% (54)88. Stanford1,743445 (75)3.9 (102)6 (125)26 (108)5.8% (127)89. Memphis1,740375 (94)4.6 (59)13 (97)37 (90)9.9% (67)90. Akron1,718375 (94)4.6 (65)7 (120)38 (87)10.1% (63)91. Central Michigan1,646381 (88)4.3 (77)18 (75)34 (96)8.9% (92)92. Southern Miss1,641438 (76)3.7 (112)11 (108)38 (87)8.7% (101)93. James Madison1,629279 (112)5.8 (6)11 (108)43 (74)15.4% (2)94. Washington State1,582344 (101)4.6 (62)10 (115)34 (96)9.9% (66)95. Pittsburgh1,577377 (91)4.2 (85)20 (71)42 (77)11.1% (37)96. Northern Illinois1,557308 (105)5.1 (23)14 (92)30 (100)9.7% (72)97. Louisiana Monroe1,528378 (89)4.0 (94)14 (92)35 (94)9.3% (85)98. Missouri State1,519378 (89)4.0 (98)16 (84)47 (66)12.4% (15)99. Maryland1,441370 (97)3.9 (107)13 (97)40 (82)10.8% (46)100. Wake Forest1,403330 (103)4.3 (82)16 (84)37 (90)11.2% (33)101. Georgia Southern1,352497 (61)2.7 (128)18 (75)29 (102)5.8% (128)101. Coastal Carolina1,352286 (111)4.7 (53)14 (92)25 (111)8.7% (99)103. California1,307420 (79)3.1 (123)15 (89)30 (100)7.1% (118)104. FIU1,286261 (116)4.9 (39)12 (105)32 (98)12.3% (17)105. Utah State1,261304 (107)4.1 (88)18 (75)23 (115)7.6% (115)106. Miami (Ohio)1,234259 (117)4.8 (51)11 (108)24 (112)9.3% (84)107. Nevada1,195304 (107)3.9 (99)6 (125)37 (90)12.2% (19)108. TCU1,162253 (118)4.6 (64)13 (97)22 (117)8.7% (100)109. South Florida1,136362 (99)3.1 (121)10 (115)32 (98)8.8% (95)110. Toledo1,111290 (110)3.8 (111)6 (125)16 (125)5.5% (130)111. Wyoming1,104244 (119)4.5 (70)7 (120)24 (112)9.8% (68)112. Navy1,063212 (123)n/a12 (105)20 (122)n/a113. Florida Atlantic1,056374 (96)2.8 (126)19 (74)27 (105)7.2% (116)114. New Mexico1,039267 (115)3.9 (108)14 (92)26 (108)9.7% (73)115. Alabama1,015244 (119)4.2 (87)16 (84)15 (129)6.1% (126)116. Colorado995333 (102)3.0 (125)13 (97)22 (117)6.6% (120)117. Georgia State985192 (127)5.1 (20)7 (120)21 (121)10.9% (42)118. Louisiana Tech940201 (125)n/a9 (117)23 (115)n/a119. Louisiana919215 (122)n/a11 (108)20 (122)n/a120. Troy903393 (86)2.3 (131)12 (105)22 (117)5.6% (129)121. New Mexico State884236 (121)3.7 (113)7 (120)19 (124)8.1% (110)122. Hawaii879279 (112)3.2 (120)8 (118)22 (117)7.9% (112)123. Charlotte875279 (112)3.1 (122)6 (125)29 (102)10.4% (52)124. San Jose State844193 (126)4.4 (76)6 (125)16 (125)8.3% (107)125. Syracuse747306 (106)2.4 (129)11 (108)27 (105)8.8% (96)126. Buffalo705164 (133)4.3 (78)5 (130)16 (125)9.8% (71)127. Notre Dame703138 (135)5.1 (21)11 (108)16 (125)11.6% (29)128. UTEP691188 (128)3.7 (115)5 (130)12 (132)6.4% (123)129. Ball State656168 (132)3.9 (104)2 (136)11 (134)6.5% (121)130. Bowling Green582143 (134)4.1 (92)5 (130)12 (132)8.4% (105)131. Arizona State569365 (98)1.6 (132)7 (120)28 (104)7.7% (113)132. Oregon State563205 (124)2.7 (127)13 (97)13 (131)6.3% (124)133. Middle Tennessee553101 (136)5.5 (9)5 (130)14 (130)13.9% (6)134. UMass540174 (130)3.1 (124)4 (135)11 (134)6.3% (125)135. Kennesaw State498188 (128)n/a5 (130)24 (112)n/a136. Kent State406174 (130)2.3 (130)8 (118)9 (136)5.2% (131)137. North Dakota State92 (138)n/a0 (137)0 (137)n/a138. Sacramento State121 (137)n/a0 (137)0 (137)n/aIt's no coincidence that 14 of the 15 teams with the most career yards rushing in the FBS have at least a 20% rushing share from quarterbacks. Florida is the only exception, and actually has one of the lower QB rushing shares in the FBS, but it also stands out for a different reason: it is the only program in the country with three running backs on its roster who have at least 1,000 career yards rushing -- Jaden Baugh (1,838), London Montgomery (1,096) and Evan Pryor (1,087).
Utah is the clearest example of how dual-threat quarterback production can reshape an entire rushing profile. No team with more than 3,000 career yards rushing on its roster leans more heavily on its quarterback, with the Utes getting 46.5% of their rushing production from Devon Dampier and Byrd Ficklin. Dampier leads all returning quarterbacks in yards rushing (2,358) and rushing touchdowns (33).
Auburn's Byrum Brown ranks second among all returning quarterbacks in career yards rushing (2,214) and is tied for second in rushing touchdowns (31), while also leading all players with 69 explosive runs. His dual-threat impact helps anchor what is projected to be the most productive rushing attack in the FBS entering 2026. Even if Auburn's quarterback production were removed and the rankings were limited strictly to running back rushing production, the Tigers would still rank second nationally behind only Liberty.
Florida, Georgia, Miami, Missouri and Oklahoma State would all move into the top 10 if only production from running backs were factored.
Louisville has the most explosive rushing team among qualified programs, posting an explosive run rate of 16.6%. Isaac Brown is a major reason why. The Cardinals nearly lost Brown to the transfer portal in January, but managed to keep one of the most dynamic backs in the country. His 18.6% explosive run rate is second among returning running backs with at least 50 career carries in the FBS.
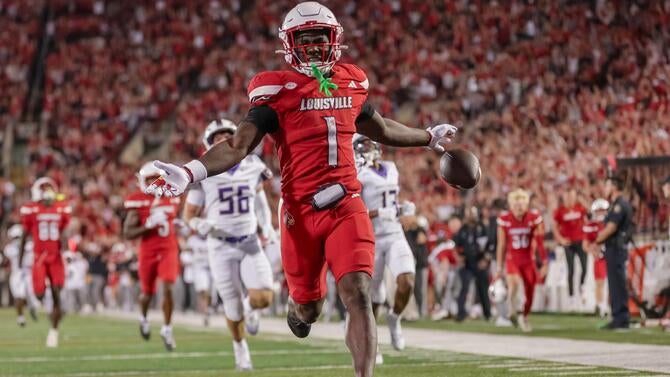 Running back Isaac Brown gives Louisville one of the most dynamic backfields in college football. Getty Images
 That kind of home-run ability is a major reason Louisville sits atop the Power Four in explosive rushing, ahead of numerous teams that rank much higher in total rushing production.
Here are the top five qualified Power Four teams in explosive run rate:
- Louisville — 16.6%
- Clemson — 14.9%
- Utah — 14.4%
- Oklahoma State — 13.5%
- Nebraska — 13.5%
Nine of the 10 teams with the best combined yards per carry on their 2026 rosters also rank inside the top 25 in explosive run rate. Missouri is the lone exception. The Tigers rank 10th among qualified teams in yards per carry (5.5) but just 47th in explosive run rate (10.8%), suggesting their rushing success is driven more by steady efficiency than breakaway runs.
Ahmad Hardy, the returning leader in career yards rushing (2,994) in the FBS, also has the best mark in yards per carry (6.0) among the 11 returning players with at least 400 career rushing attempts, illustrating just how effective he has been on a per-carry basis even without overly relying on explosive plays (11.3%).
Receiving production
Minimum thresholds: Yards/Reception and Explosive Reception % (teams with ≥50 targets AND ≥35 WR targets)
TeamYds.Rec.Yd/RecTDExpl. Rec.ExplRec%1. Texas Tech7,882635 (1)12.4 (37)61 (2)157 (1)24.7% (47)2. LSU6,935529 (4)13.1 (15)60 (3)144 (2)27.2% (22)3. Houston6,642582 (2)11.4 (73)48 (4)139 (3)23.9% (56)4. Ohio State6,511531 (3)12.3 (44)64 (1)126 (4)23.7% (58)5. Oklahoma State6,300464 (10)13.6 (9)47 (5)124 (5)26.7% (30)6. Oklahoma6,138515 (5)11.9 (52)46 (7)123 (6)23.9% (55)7. Ole Miss6,082479 (7)12.7 (26)41 (12)122 (7)25.5% (42)8. Florida5,763466 (8)12.4 (38)33 (21)117 (10)25.1% (45)9. Miami5,683436 (14)13.0 (17)42 (11)120 (8)27.5% (18)10. Illinois5,637431 (16)13.1 (16)43 (9)120 (8)27.8% (15)11. California5,621465 (9)12.1 (49)34 (19)116 (11)24.9% (46)12. Texas5,588460 (12)12.1 (48)47 (5)113 (14)24.6% (49)13. Texas A&M5,448432 (15)12.6 (28)41 (12)114 (13)26.4% (34)14. Arizona State5,412361 (29)15.0 (3)37 (17)113 (14)31.3% (5)15. Colorado5,372394 (23)13.6 (7)40 (15)105 (18)26.6% (32)16. Clemson5,364429 (18)12.5 (34)39 (16)110 (16)25.6% (38)17. Virginia5,319483 (6)11.0 (84)24 (46)97 (20)20.1% (99)18. Oregon5,160415 (19)12.4 (36)35 (18)108 (17)26.0% (35)19. South Florida5,129447 (13)11.5 (69)41 (12)94 (23)21.0% (90)20. UCLA5,094464 (10)11.0 (88)34 (19)94 (23)20.3% (97)21. Vanderbilt4,801363 (28)13.2 (13)43 (9)116 (11)32.0% (3)22. Auburn4,762406 (20)11.7 (60)44 (8)85 (29)20.9% (92)23. Penn State4,710368 (27)12.8 (23)27 (36)95 (21)25.8% (37)24. SMU4,646399 (21)11.6 (62)31 (24)91 (26)22.8% (67)25. Virginia Tech4,614390 (24)11.8 (57)31 (24)95 (21)24.4% (50)26. Florida Atlantic4,352383 (25)11.4 (75)26 (42)93 (25)24.3% (52)27. South Carolina4,341327 (33)13.3 (11)33 (21)100 (19)30.6% (7)28. Nebraska4,215374 (26)11.3 (79)28 (32)81 (32)21.7% (78)29. Baylor4,209431 (16)9.8 (121)33 (21)77 (36)17.9% (119)30. Missouri4,173322 (35)13.0 (19)28 (32)87 (27)27.0% (25)31. Florida State4,155319 (36)13.0 (18)27 (36)87 (27)27.3% (20)32. Indiana4,099310 (40)13.2 (14)27 (36)79 (33)25.5% (40)33. Maryland4,070399 (21)10.2 (107)29 (31)79 (33)19.8% (103)34. Utah4,060306 (42)13.3 (12)27 (36)83 (30)27.1% (24)35. Minnesota3,996351 (31)11.4 (74)27 (36)75 (39)21.4% (83)36. Texas State3,964313 (38)12.7 (27)26 (42)77 (36)24.6% (48)37. Alabama3,865307 (41)12.6 (29)26 (42)82 (31)26.7% (31)38. Kansas3,723347 (32)10.7 (91)24 (46)70 (43)20.2% (98)39. Arkansas3,666312 (39)11.8 (58)25 (45)76 (38)24.4% (50)40. Wake Forest3,661268 (52)13.7 (6)30 (29)72 (40)26.9% (28)41. Louisville3,631294 (48)12.4 (39)28 (32)78 (35)26.5% (33)42. Hawaii3,546353 (30)10.0 (114)31 (24)70 (43)19.8% (102)43. Kansas State3,456326 (34)10.6 (96)31 (24)70 (43)21.5% (80)44. NC State3,326267 (53)12.5 (35)31 (24)72 (40)27.0% (26)45. San Diego State3,290295 (47)11.2 (80)16 (71)58 (60)19.7% (105)46. Delaware3,273317 (37)10.3 (103)19 (61)63 (53)19.9% (101)47. Notre Dame3,212236 (64)13.6 (8)28 (32)67 (48)28.4% (12)48. Tulsa3,206300 (44)10.7 (93)13 (89)68 (47)22.7% (69)49. West Virginia3,199260 (54)12.3 (40)17 (65)70 (43)26.9% (27)50. Arizona3,184290 (50)11.0 (87)22 (53)57 (62)19.7% (106)51. Mississippi State3,167252 (59)12.6 (33)17 (65)60 (57)23.8% (57)52. Northwestern3,116299 (45)10.4 (100)24 (46)60 (57)20.1% (100)53. Purdue3,100304 (43)10.2 (108)22 (53)65 (50)21.4% (82)54. Michigan State3,071259 (55)11.9 (55)27 (36)57 (62)22.0% (76)55. Washington3,058243 (62)12.6 (30)22 (53)71 (42)29.2% (9)56. UNLV2,994291 (49)10.3 (105)13 (89)57 (62)19.6% (107)57. UCF2,928255 (57)11.5 (68)17 (65)59 (59)23.1% (64)58. Marshall2,920210 (75)13.9 (4)30 (29)67 (48)31.9% (4)59. Liberty2,773231 (67)12.0 (51)10 (107)49 (69)21.2% (87)60. Kentucky2,758235 (66)11.7 (59)21 (56)63 (53)26.8% (29)61. East Carolina2,755258 (56)10.7 (94)17 (65)57 (62)22.1% (74)62. Memphis2,747243 (62)11.3 (77)13 (89)48 (71)19.8% (104)63. Tennessee2,741230 (68)11.9 (53)17 (65)51 (68)22.2% (73)64. Georgia2,737228 (69)12.0 (50)23 (51)63 (53)27.6% (17)65. Duke2,715271 (51)10.0 (115)24 (46)49 (69)18.1% (117)66. UAB2,698244 (60)11.1 (82)13 (89)63 (53)25.8% (36)67. Missouri State2,682209 (77)12.8 (21)23 (51)65 (50)31.1% (6)68. Rutgers2,673197 (83)13.6 (10)18 (62)65 (50)33.0% (2)69. Arkansas State2,670296 (46)9.0 (130)18 (62)46 (76)15.5% (127)70. North Texas2,604224 (72)11.6 (63)21 (56)52 (67)23.2% (63)71. Western Kentucky2,592236 (64)11.0 (86)18 (62)44 (83)18.6% (112)72. Syracuse2,528206 (79)12.3 (43)17 (65)58 (60)28.2% (13)73. Iowa State2,509197 (83)12.7 (25)16 (71)54 (66)27.4% (19)74. Fresno State2,471253 (58)9.8 (120)15 (77)45 (79)17.8% (120)75. New Mexico State2,439221 (73)11.0 (83)14 (79)47 (73)21.3% (85)76. UTSA2,422226 (71)10.7 (92)21 (56)44 (83)19.5% (108)77. Colorado State2,336190 (86)12.3 (41)14 (79)43 (86)22.6% (70)78. North Carolina2,306228 (69)10.1 (110)14 (79)43 (86)18.9% (110)79. TCU2,298201 (80)11.4 (71)16 (71)45 (79)22.4% (71)79. Toledo2,298209 (77)11.0 (85)11 (99)45 (79)21.5% (79)81. Washington State2,294244 (60)9.4 (126)14 (79)46 (76)18.9% (111)82. Eastern Michigan2,263194 (85)11.7 (61)16 (71)41 (88)21.1% (89)83. Utah State2,207198 (82)11.1 (81)14 (79)44 (83)22.2% (72)84. Middle Tennessee2,151186 (87)11.6 (65)14 (79)41 (88)22.0% (75)85. Tulane2,144217 (74)9.9 (117)11 (99)47 (73)21.7% (77)86. Georgia Southern2,126201 (80)10.6 (98)16 (71)41 (88)20.4% (95)87. Akron2,055168 (93)12.2 (45)11 (99)47 (73)28.0% (14)88. Michigan2,013165 (95)12.2 (46)13 (89)45 (79)27.3% (20)89. USC1,997156 (98)12.8 (22)11 (99)46 (76)29.5% (8)90. BYU1,989210 (75)9.5 (124)12 (95)37 (93)17.6% (122)91. Temple1,938169 (92)11.5 (70)24 (46)48 (71)28.4% (11)92. Wisconsin1,898184 (88)10.3 (104)12 (95)33 (99)17.9% (118)93. Pittsburgh1,897168 (93)11.3 (78)12 (95)36 (95)21.4% (81)94. Iowa1,875181 (89)10.4 (102)14 (79)37 (93)20.4% (94)95. Georgia Tech1,861157 (97)11.9 (56)6 (118)40 (91)25.5% (41)96. Louisiana Tech1,787147 (102)12.2 (47)7 (115)40 (91)27.2% (23)97. Buffalo1,776175 (91)10.1 (109)11 (99)32 (102)18.3% (115)98. Central Michigan1,771137 (103)12.9 (20)14 (79)35 (97)25.5% (39)99. Boise State1,742151 (100)11.5 (67)14 (79)32 (102)21.2% (88)100. Sam Houston1,740177 (90)9.8 (119)11 (99)33 (99)18.6% (112)101. Boston College1,735164 (96)10.6 (97)15 (77)35 (97)21.3% (84)102. New Mexico1,635133 (106)12.3 (42)16 (71)32 (102)24.1% (54)103. Coastal Carolina1,615152 (99)10.6 (95)21 (56)36 (95)23.7% (60)104. Western Michigan1,588148 (101)10.7 (90)6 (118)31 (105)20.9% (91)105. Louisiana Monroe1,575114 (112)13.8 (5)8 (112)33 (99)28.9% (10)106. UMass1,525128 (109)11.9 (54)21 (56)30 (108)23.4% (61)107. UConn1,484118 (110)12.6 (32)14 (79)28 (110)23.7% (58)108. Northern Illinois1,432133 (106)10.8 (89)8 (112)27 (111)20.3% (96)109. Jacksonville State1,40693 (122)15.1 (2)9 (110)31 (105)33.3% (1)110. Charlotte1,398136 (104)10.3 (106)12 (95)31 (105)22.8% (68)111. Louisiana1,371130 (108)10.5 (99)11 (99)30 (108)23.1% (65)112. FIU1,310136 (104)9.6 (123)6 (118)23 (116)16.9% (125)113. Cincinnati1,308104 (118)12.6 (31)13 (89)24 (114)23.1% (65)114. Kent State1,243107 (115)11.6 (64)9 (110)25 (112)23.4% (62)115. UTEP1,175118 (110)10.0 (116)3 (130)22 (117)18.6% (112)116. Georgia State1,174113 (113)10.4 (101)8 (112)24 (114)21.2% (86)117. Ball State1,168103 (119)11.3 (76)10 (107)25 (112)24.3% (53)118. Rice1,11387 (126)12.8 (24)7 (115)22 (117)25.3% (43)119. Stanford1,080107 (115)10.1 (111)3 (130)22 (117)20.6% (93)120. Miami (Ohio)1,067106 (117)10.1 (112)6 (118)17 (122)16.0% (126)121. Kennesaw State1,03990 (124)11.5 (66)5 (123)16 (124)17.8% (121)122. Southern Miss1,009108 (114)9.3 (127)7 (115)19 (121)17.6% (123)123. Oregon State99387 (126)11.4 (72)10 (107)22 (117)25.3% (43)124. App State943102 (121)9.2 (128)5 (123)15 (126)14.7% (129)125. James Madison93693 (122)10.1 (113)11 (99)17 (122)18.3% (116)126. South Alabama929103 (119)9.0 (131)6 (118)16 (124)15.5% (128)127. Wyoming86790 (124)9.6 (122)2 (134)12 (130)13.3% (130)128. Sacramento State79080 (128)9.9 (118)4 (125)10 (131)12.5% (132)129. Army73947 (132)15.7 (1)4 (125)13 (128)27.7% (16)130. Ohio69974 (129)9.4 (125)2 (134)13 (128)17.6% (124)131. Nevada66673 (130)9.1 (129)3 (130)14 (127)19.2% (109)132. San Jose State40646 (133)8.8 (132)1 (136)6 (135)13.0% (131)133. Troy39954 (131)7.4 (133)4 (125)4 (137)7.4% (133)134. Old Dominion35639 (134)n/a3 (130)7 (133)n/a135. Navy35225 (135)n/a4 (125)7 (133)n/a136. Bowling Green29022 (136)n/a4 (125)5 (136)n/a137. Air Force26413 (137)n/a1 (136)9 (132)n/a138. North Dakota State00 (138)n/a0 (138)0 (138)n/aHere's a striking stat: Of the 30 teams with the most career yards receiving on their roster in 2026, only Nebraska brings back both of its top two pass catchers from last season.
With early NFL Draft departures accounting for more than a dozen of those losses and the transfer portal driving additional movement, stability among proven pass catchers is increasingly difficult to maintain in college football. In fact, 36 of the 72 active players with at least 1,000 career yards receiving in the FBS are now at new schools in 2026.
Texas Tech and LSU both watched their two leading pass catchers from last season depart, but each aggressively attacked the transfer portal to replenish that lost production, which helps explain why both sit atop the FBS in receiving production entering 2026.
Texas Tech pairs portal additions with meaningful contributions from returning players. The Red Raiders bring back wide receiver Coy Eakin and tight end Terrance Carter Jr., both of whom finished among the top 20 in the Big 12 in receiving yards last season. They also added former Pittsburgh receiver Kenny Johnson, who brings 1,354 career receiving yards across 38 games, giving Joey McGuire one of the deepest and most battle-tested receiver groups in the country.
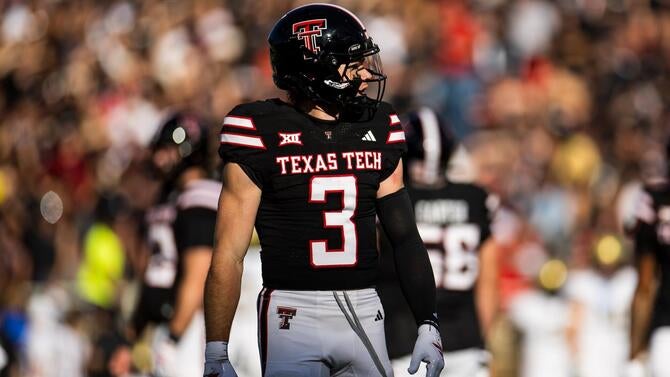 Coy Eakin is part of an experienced wide receiver group at Texas Tech. Getty Images
 LSU, meanwhile, almost completely overhauled its receiver room. The Tigers added nine newcomers from the portal, including five four-star transfers eager to contribute to new coach Lane Kiffin's offense. Three of those marquee additions already have at least 1,000 career receiving yards in the FBS and have combined for 36 touchdown receptions: Jayce Brown (1,969), Jackson Harris (1,049) and Eugene Wilson III (1,043).
Houston was highlighted in our breakdown of college football's most experienced teams last week. No team in the FBS has more combined career snaps by wide receivers and tight ends on its 2026 roster than the Cougars (7,755).
All-Big 12 selection Amare Thomas is one of just five returning players in the FBS with at least 2,000 career yards receiving. The Cougars also added former Oregon State receiver Trent Walker, giving them two pass catchers ranked inside the top 12 among active FBS players in career yards receiving.
Tight ends are a vital part of the Houston offense. Even after losing All-Big 12 tight end Tanner Koziol, the Cougars remain one of only eight teams in the FBS with at least 3,000 career yards receiving from wide receivers and 1,000 from tight ends. The addition of former UTSA tight end Patrick Overmyer, who brings 627 career yards receiving, helps soften that loss and preserve valuable production at the position.
Several of the teams near the top in explosive reception rate owe that ranking to a handful of true field-tilters; receivers capable of turning routine targets into chunk plays at an unusually high clip.
Arizona State owns the fifth-best explosive reception rate (31.3%) in the FBS and ranks third among qualified Power Four programs after assembling one of the most dangerous receiver rooms in the country this offseason. The Sun Devils added two of the top four transfer wideouts in former Boston College pass catcher Reed Harris and ex-Colorado receiver Omarion Miller.
Harris owns the best individual explosive reception rate (50.9%) of any returning player with at least 50 career catches in the FBS, meaning more than half of his receptions went for at least 16 yards. Miller ranks sixth nationally at 45.5%.
That's a terrifying proposition for opposing secondaries.
Here are the top five qualified Power Four teams in explosive reception rate:
- Rutgers — 33.0%
- Vanderbilt — 32.0%
- Arizona State — 31.3%
- South Carolina — 30.6%
- USC — 29.5%
Now that we've looked at passing, rushing and receiving individually, what happens if we combine them into a single offensive execution profile?
First off, a bit of explaining to make this easier to understand. These are not traditional team-level stats, but rather metrics built from the combined efficiency of returning and incoming offensive personnel for each qualified FBS team in 2026. These numbers estimate how each team's offensive personnel projects based on individual player efficiency. This section focuses on two core indicators: successful play rate and explosive touch rate.
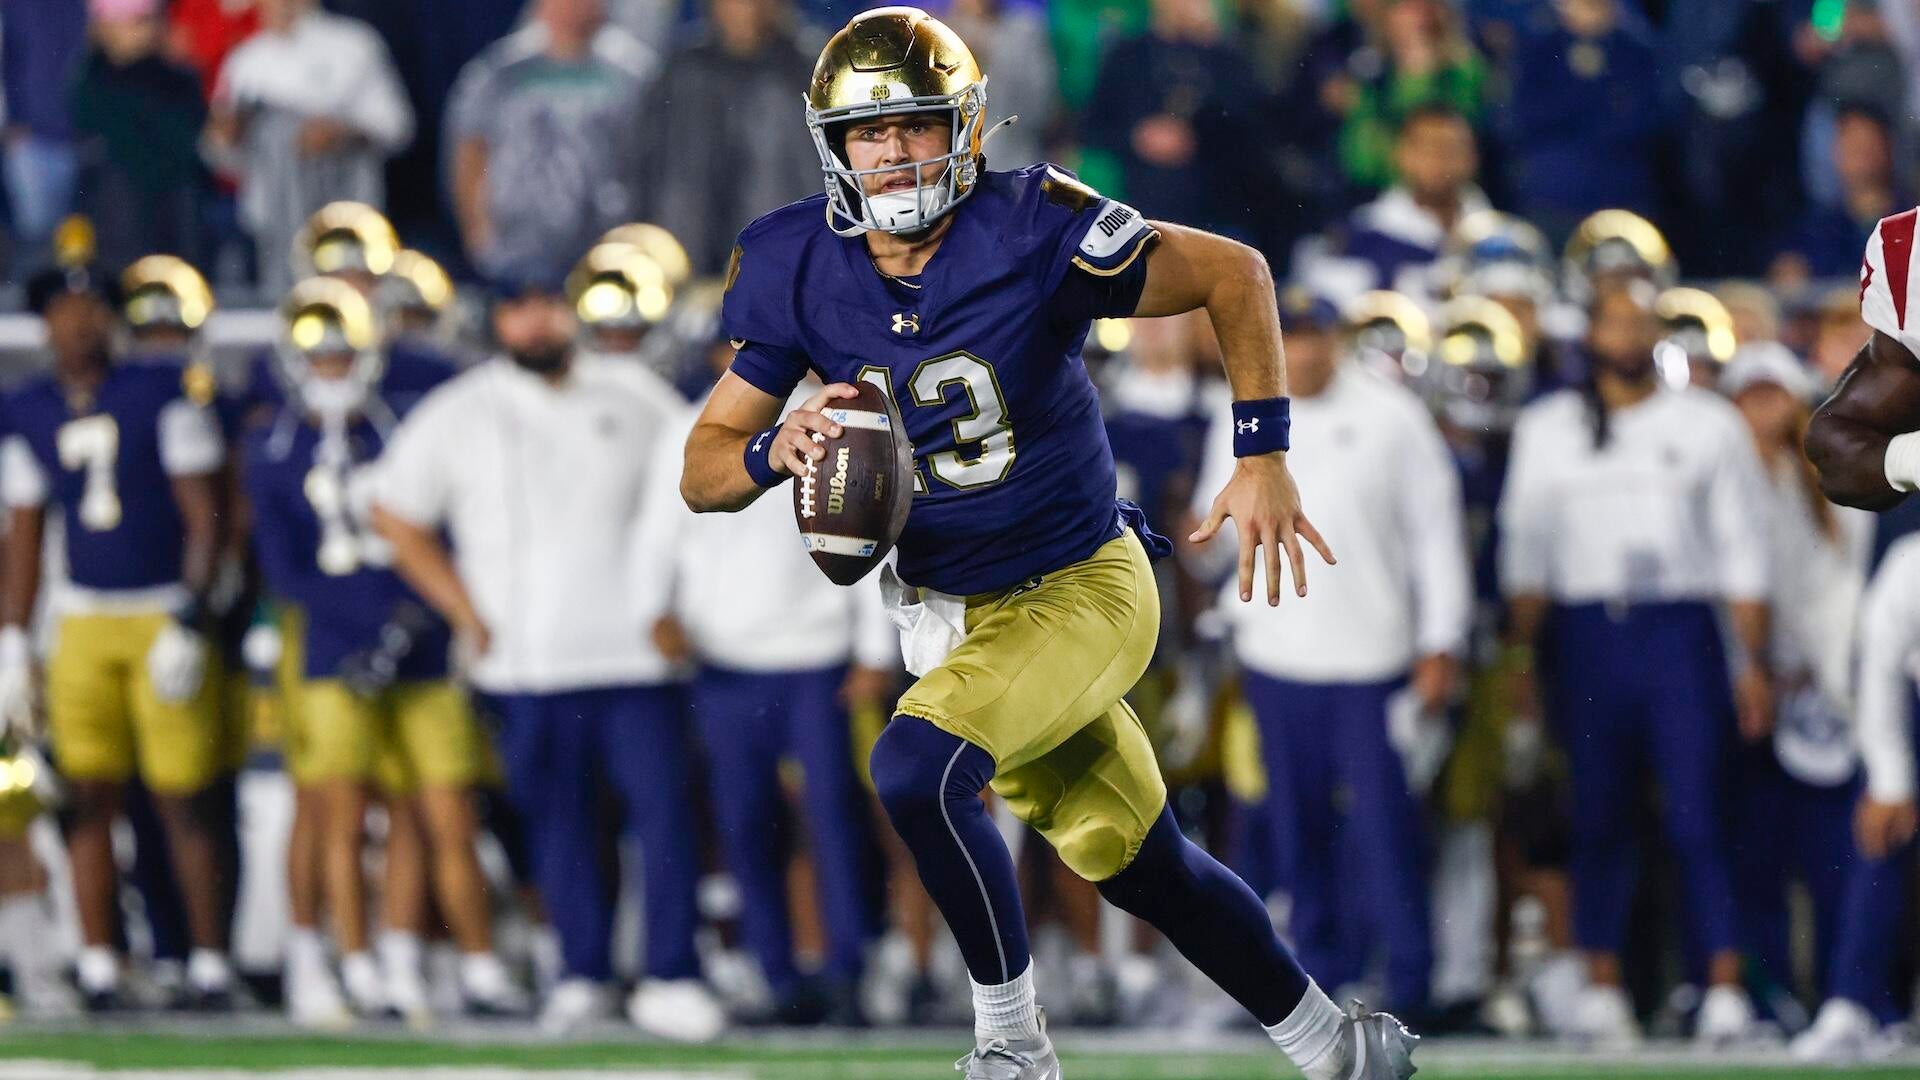
Per TruMedia, a play is defined as any pass attempt, target or rush. A play is considered successful if it gains at least 50% of yards-to-go on first and second down, or converts a first down on third or fourth down. In simple terms, it measures how often a player gets the ball and helps keep the offense on schedule.
Explosive touch rate measures chunk-play ability. A touch is defined as either a rush or a reception, while an explosive touch is any rush of at least 12 yards or a reception of at least 16 yards.
Teams are ranked against the rest of the qualified FBS in both metrics, with final placement determined by each team's average ranking across the two.
Offensive efficiency profile
Minimum thresholds: Successful Play % (teams with ≥50 dropbacks, ≥50 RB rushes AND ≥35 WR targets); Explosive Touch% (teams with ≥70 rushes AND ≥30 receptions); Drop% (teams with ≥50 targets AND ≥35 WR targets); Fumble% (teams with ≥100 touches)
Teams ordered by average FBS ranking across Success% and Expl. Touch%
TeamSuccess%Expl. Touch%Drop%Fum%1. Notre Dame54.8% (2)22.2% (1)4.7% (34)0.8% (16)2. Oklahoma State52.0% (4)18.5% (7)4.8% (36)1.2% (35)3. Ohio State56.4% (1)17.9% (12)2.8% (2)0.7% (12)4. Vanderbilt51.3% (6)18.1% (11)3.9% (15)1.6% (56)5. Alabama51.0% (7)17.6% (14)8.5% (125)0.7% (14)6. Utah50.7% (8)17.5% (15)4.4% (26)2.5% (110)7. Texas Tech49.5% (19)18.4% (8)5.3% (53)1.3% (41)8. Wake Forest49.0% (23)18.2% (9)7.4% (114)2.2% (95)9. Texas A&M49.4% (20)17.8% (13)5.9% (76)1.6% (60)10. Clemson48.4% (32)21.2% (2)6.3% (92)1.1% (26)11. USC50.3% (11)16.8% (24)6.6% (98)2.3% (104)12. Ole Miss50.3% (10)16.6% (29)4.7% (33)1.9% (82)13. Arkansas50.4% (9)16.3% (33)5.6% (67)0.9% (20)14. Miami51.6% (5)15.9% (38)4.1% (19)1.8% (75)14. Texas State49.4% (21)16.9% (22)5.1% (43)2.3% (102)16. Washington49.2% (22)16.7% (26)4.6% (29)1.8% (70)17. Florida49.5% (18)15.8% (40)5.5% (66)0.5% (5)17. Oregon48.5% (31)16.6% (27)4.8% (37)3.1% (123)19. LSU48.4% (34)16.7% (25)6.0% (81)1.1% (29)19. Middle Tennessee46.4% (54)19.2% (5)7.9% (116)1.7% (68)21. Nebraska47.5% (41)17.0% (20)3.3% (8)3.0% (122)22. Virginia Tech48.7% (28)16.3% (34)5.2% (50)1.1% (28)23. Missouri49.6% (15)15.4% (48)5.5% (63)2.0% (89)23. Oklahoma49.9% (12)15.0% (51)4.6% (31)0.9% (21)25. Arizona State45.9% (61)19.4% (4)4.9% (39)4.1% (134)26. Rutgers48.3% (35)16.2% (35)5.8% (73)0.8% (17)27. California47.4% (43)16.5% (31)4.1% (18)1.9% (83)28. South Carolina46.3% (56)16.9% (21)6.2% (88)2.3% (100)29. Mississippi State46.0% (60)17.0% (18)6.6% (99)2.1% (92)29. Tennessee49.8% (13)14.3% (65)7.3% (113)1.3% (36)31. Jacksonville State46.6% (50)16.5% (30)9.3% (129)2.6% (111)32. Indiana49.6% (17)14.3% (66)4.9% (40)2.8% (117)32. Michigan49.6% (16)14.3% (67)5.5% (65)1.8% (77)34. Houston48.0% (37)15.3% (49)5.2% (47)1.3% (38)35. Illinois48.9% (24)14.4% (63)5.2% (48)1.5% (55)35. North Texas45.4% (68)17.0% (19)6.9% (109)1.6% (59)37. Florida Atlantic46.6% (51)15.9% (39)3.0% (3)3.4% (129)37. Kansas State46.9% (47)15.6% (43)6.3% (90)1.6% (57)37. UCLA47.8% (38)14.9% (52)5.2% (51)1.7% (65)40. Georgia State47.6% (40)14.8% (54)9.6% (130)1.6% (63)41. Duke48.8% (26)14.2% (69)4.2% (21)1.3% (40)42. NC State46.3% (57)15.7% (41)3.8% (14)2.9% (120)43. Hawaii47.4% (44)14.6% (57)8.3% (121)0.9% (22)44. Virginia48.7% (27)13.9% (75)6.3% (91)1.5% (52)45. Florida State46.4% (53)15.1% (50)6.3% (89)1.7% (66)46. Auburn48.9% (25)13.7% (79)6.1% (86)1.9% (78)47. Georgia52.3% (3)12.6% (103)7.0% (110)1.5% (53)47. New Mexico46.8% (48)14.5% (58)5.4% (59)2.0% (88)49. Iowa49.8% (14)12.9% (95)5.6% (68)0.5% (6)49. Missouri State42.8% (103)19.1% (6)5.4% (56)1.2% (31)51. Marshall43.9% (94)17.2% (17)5.1% (44)3.3% (125)52. SMU48.6% (30)13.6% (83)5.3% (54)1.8% (76)53. Syracuse44.5% (87)16.6% (28)6.2% (87)4.7% (136)54. Texas44.1% (93)16.8% (23)5.1% (46)1.4% (50)55. Eastern Michigan46.4% (55)14.4% (62)4.0% (16)2.4% (106)56. Colorado42.3% (106)17.5% (16)6.1% (84)1.8% (72)57. Iowa State45.5% (67)14.6% (56)5.3% (52)2.5% (109)58. East Carolina48.6% (29)12.8% (98)6.8% (104)2.6% (112)58. New Mexico State45.6% (66)14.4% (61)6.9% (106)1.3% (42)58. UAB43.7% (95)16.4% (32)8.5% (124)1.3% (43)61. Minnesota47.8% (39)13.2% (91)4.4% (27)0.4% (4)62. Delaware46.6% (49)13.5% (85)5.5% (64)1.8% (73)63. Kentucky45.8% (63)14.0% (72)6.0% (83)1.3% (44)64. Kansas44.6% (81)14.6% (55)8.9% (126)1.4% (49)65. Colorado State44.3% (91)15.5% (46)8.4% (122)1.2% (33)65. Penn State47.3% (45)13.1% (92)6.6% (97)1.4% (48)67. UTSA46.1% (58)13.6% (80)4.8% (38)2.4% (107)68. Purdue45.2% (70)13.9% (73)6.4% (94)2.7% (114)68. South Florida43.2% (99)15.6% (44)6.5% (95)3.3% (126)68. West Virginia43.3% (98)15.5% (45)6.5% (96)2.3% (101)71. BYU47.1% (46)12.6% (101)5.9% (76)1.8% (69)71. Coastal Carolina45.0% (73)13.9% (74)4.5% (28)2.1% (91)71. UConn44.8% (76)14.0% (71)6.9% (107)1.9% (84)74. Central Michigan45.9% (62)13.3% (87)5.4% (55)2.1% (94)75. UNLV46.0% (59)12.9% (93)6.3% (93)1.5% (54)76. FIU44.8% (78)13.9% (76)3.3% (6)2.8% (116)77. Western Michigan48.0% (36)11.2% (120)9.6% (131)1.3% (39)78. Maryland41.3% (110)15.5% (47)7.1% (112)1.0% (25)79. Pittsburgh44.4% (90)14.3% (68)5.6% (69)2.2% (99)80. Tulsa45.1% (71)13.3% (88)6.1% (85)2.2% (95)81. Arizona46.6% (52)12.1% (111)6.0% (80)1.4% (51)81. Boise State47.5% (42)11.1% (121)8.0% (118)1.9% (81)81. Utah State44.8% (77)13.3% (86)5.4% (56)2.2% (97)84. Army48.4% (33)6.8% (132)9.2% (128)1.2% (34)85. Baylor45.6% (64)12.1% (109)5.7% (70)1.3% (46)86. Charlotte39.9% (115)14.5% (60)5.7% (71)3.4% (127)87. Michigan State45.6% (65)11.9% (114)5.1% (42)1.8% (71)88. UCF44.8% (79)12.7% (100)4.6% (30)5.3% (137)89. Nevada42.9% (101)13.5% (84)3.2% (5)2.7% (113)90. Tulane44.6% (85)12.5% (104)7.9% (117)3.4% (128)90. Western Kentucky44.6% (84)12.2% (105)4.2% (20)1.6% (64)92. Louisiana Monroe40.1% (114)13.8% (77)5.7% (71)2.4% (108)92. UMass41.5% (109)13.6% (82)6.8% (103)2.0% (86)94. Miami (Ohio)44.9% (74)11.2% (119)4.8% (35)1.4% (47)94. Northwestern44.9% (75)11.3% (118)5.2% (49)2.0% (90)96. Cincinnati45.4% (69)10.6% (125)4.4% (24)2.7% (115)96. San Diego State44.5% (86)12.2% (108)6.8% (102)1.2% (32)98. Liberty44.6% (80)11.8% (115)3.3% (7)1.7% (67)98. Oregon State44.6% (83)12.0% (112)10.3% (133)4.5% (135)100. South Alabama44.6% (82)11.7% (117)5.4% (60)2.4% (105)101. San Jose State45.0% (72)9.2% (130)8.5% (123)1.3% (37)102. North Carolina44.4% (88)11.7% (116)5.9% (79)1.6% (58)103. Northern Illinois41.0% (112)12.9% (96)3.2% (4)1.8% (74)104. Wisconsin43.4% (97)12.0% (113)3.5% (9)2.9% (118)105. Rice42.6% (105)12.2% (106)5.4% (56)2.2% (98)106. Arkansas State44.3% (92)11.1% (123)3.6% (13)1.9% (80)106. Sam Houston40.2% (113)12.6% (102)6.6% (100)0.8% (18)106. Toledo41.7% (108)12.2% (107)6.9% (105)0.6% (9)109. Georgia Southern44.4% (89)10.0% (128)5.4% (60)3.3% (124)110. Kent State36.5% (116)12.1% (110)6.7% (101)3.6% (130)110. Wyoming42.9% (102)10.8% (124)4.3% (23)0.3% (2)112. Stanford43.7% (96)8.7% (131)3.6% (10)1.6% (61)113. Ohio43.0% (100)9.8% (129)6.0% (82)2.0% (87)114. Southern Miss42.7% (104)10.4% (126)5.9% (78)3.8% (133)115. App State41.0% (111)10.2% (127)10.3% (132)2.1% (93)116. Troy41.9% (107)5.8% (133)5.8% (74)2.9% (119)Air Forcen/an/an/a2.0% (85)Akronn/a15.7% (42)8.1% (119)0.6% (7)Ball Staten/a13.3% (89)5.9% (75)0.7% (15)Boston Collegen/a12.9% (94)2.6% (1)0.3% (3)Bowling Greenn/an/an/a0.6% (10)Buffalon/a14.2% (70)5.1% (45)0.6% (8)Fresno Staten/a12.9% (97)3.6% (11)0.7% (13)Georgia Techn/a16.1% (37)4.4% (25)0.7% (11)James Madisonn/a16.1% (36)7.9% (115)1.3% (45)Kennesaw Staten/a14.4% (64)6.9% (108)3.6% (131)Louisianan/a14.5% (59)8.9% (127)2.3% (103)Louisiana Techn/a18.1% (10)4.6% (32)1.1% (30)Louisvillen/a20.2% (3)5.4% (60)1.1% (27)Memphisn/a13.8% (78)7.0% (111)1.0% (23)Navyn/an/an/a3.8% (132)North Dakota Staten/an/an/an/aOld Dominionn/a13.3% (90)n/a3.0% (121)Sacramento Staten/an/a4.0% (17)1.0% (24)TCUn/a14.8% (53)5.0% (41)0.2% (1)Templen/a12.8% (99)3.6% (12)0.9% (19)UTEPn/a11.1% (122)8.1% (120)1.6% (62)Washington Staten/a13.6% (81)4.3% (22)1.9% (79)Notre Dame sits clearly at the top of the table, pairing the second-best successful play rate in the FBS (54.8%) with the best explosive touch rate (22.2%). There is one important caveat, though: the Fighting Irish are operating with one of the smaller running back samples among qualified teams, bringing back just 113 running back touches after both Jeremiah Love and Jadarian Price were selected in the first round of the 2026 NFL Draft.
That underscores the importance of quarterback CJ Carr and receiver Jordan Faison as the engines of this offense. Faison owns the second-best individual success rate (63.2%) among all returning players with at least 100 career offensive plays in the FBS, while Carr ranks seventh among qualified quarterbacks at 52.7%. Together, they help give Notre Dame one of the highest offensive ceilings in the country.
Ohio State, meanwhile, ranks first nationally in overall success rate (56.4%), which should come as little surprise after the Buckeyes led the FBS in offensive success rate last season at 56.3%. Their ranking is driven by elite efficiency from all three major positions. Quarterback Julian Sayin (58.8%), running back Bo Jackson (56.8%) and wide receiver Jeremiah Smith (65.0%) all rank inside the top 30 nationally in individual success rate among qualified players, giving Ohio State arguably the most balanced high-efficiency core in college football entering 2026.
Oklahoma State might be the most fascinating team in this table. The Cowboys finished last season with the worst offensive success rate among Power Four teams (37.9%) and the sixth-worst mark in the entire FBS, making their second-place ranking in combined success rate of its personnel potentially one of the most dramatic offensive turnarounds this upcoming season.
That leap is largely tied to new coach Eric Morris and the migration of key North Texas playmakers to Stillwater. Running back Caleb Hawkins owns the fourth-best individual success rate (62.0%) among all qualified players and leads all running backs nationally. Quarterback Drew Mestemaker (53.2%) and receiver Miles Coleman (52.8%) also rank inside the top 80, giving Oklahoma State a completely different offensive foundation than the one that struggled so badly a year ago.
Several programs in this table show a clear gap between explosiveness and down-to-down success, where volatility starts to show up.
- Clemson: 2nd explosive, 32nd success
- Arizona State: 4th explosive, 61st success
- Texas: 23rd explosive, 93rd success (!!)
- Colorado: 16th explosive, 103rd success (!!)
All four have the personnel to hit chunk plays, but there could be questions about how often the offense actually stays on track.
Then there's Georgia, which functions as the inverse. The Bulldogs rank third nationally in success rate (52.3%) but just 103rd in explosive touch rate (12.6%). Rather than relying on home-run plays, Georgia's offensive personnel is highly efficient and built to stay ahead of the chains.
But none of those profiles matter much without knowing what's happening up front.
The figures in the table below are not traditional team-level offensive line statistics. Instead, they are built from individual offensive lineman performance and aggregated at the roster level, with teams included only if they have at least three linemen with 100 or more pass-block snaps.
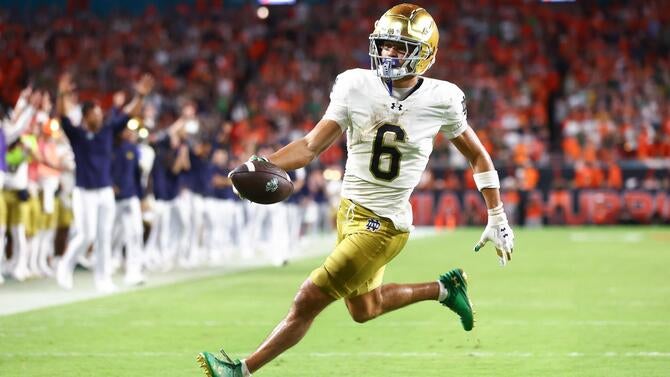 Notre Dame receiver Jordan Faison, again, figures to be a reliable weapon for quarterback CJ Carr. Getty Images
 Offensive line performance
Minimum thresholds: Pass Block Lost%, Pressure Allowed % and Sack Allowed % (min. 3 offensive lineman with ≥100 pass block snaps)
TeamPsBlk Lost%Prsr%Sack%Pass BlocksRun Blocks1. Oregon4.2%2.2% (1)<0.1% (1)2,012 (66)2,154 (54)2. Iowa4.5%2.7% (2)0.3% (17)925 (120)1,395 (92)3. Louisiana Monroe5.0%3.5% (20)0.6% (47)896 (121)1,064 (109)4. Utah State5.4%3.4% (16)0.7% (76)1,972 (68)1,417 (91)5. Indiana5.5%3.2% (8)0.4% (27)3,665 (19)4,163 (6)6. Tennessee5.5%3.4% (19)0.3% (11)3,447 (26)2,964 (27)7. Texas Tech5.5%3.1% (7)0.6% (51)3,695 (14)3,131 (19)8. Miami5.6%3.1% (5)0.5% (37)1,203 (104)1,209 (102)9. UConn5.6%3.3% (11)0.4% (30)1,126 (110)962 (115)10. UAB5.8%3.1% (4)0.4% (29)1,402 (91)1,131 (104)11. Cincinnati5.8%3.3% (12)0.3% (8)2,126 (64)1,890 (70)12. Wake Forest5.8%3.5% (21)0.6% (55)1,037 (114)895 (119)13. TCU5.8%3.0% (3)0.4% (22)3,552 (25)2,976 (26)14. Houston5.8%3.3% (13)0.4% (26)3,607 (22)3,776 (9)15. West Virginia5.9%4.0% (36)0.2% (5)3,641 (21)4,418 (4)16. Minnesota6.0%3.4% (17)0.6% (73)2,471 (52)2,108 (59)17. Georgia6.0%3.6% (24)0.2% (4)2,435 (55)2,279 (51)18. Jacksonville State6.0%4.8% (74)0.3% (15)933 (117)1,247 (97)19. Texas6.1%3.8% (34)0.2% (6)2,629 (46)2,206 (53)20. SMU6.2%3.8% (30)0.6% (48)3,221 (30)2,550 (37)21. Ole Miss6.3%3.5% (22)0.6% (54)3,674 (17)3,048 (23)22. Army6.3%3.4% (15)0.3% (7)1,091 (112)4,639 (2)23. Arkansas6.4%3.8% (33)0.4% (24)3,652 (20)3,538 (12)24. LSU6.4%3.9% (35)0.5% (38)3,757 (13)2,586 (36)25. Vanderbilt6.4%3.8% (32)0.7% (82)2,760 (40)2,739 (31)26. Penn State6.4%3.2% (10)0.1% (2)1,755 (73)1,996 (61)27. UTSA6.4%3.7% (29)0.5% (41)2,862 (39)2,353 (48)28. Maryland6.4%3.8% (31)0.3% (18)3,685 (16)2,722 (32)29. New Mexico State6.5%3.2% (9)0.3% (14)1,289 (98)984 (113)30. Rice6.6%3.4% (18)0.3% (9)702 (125)1,529 (84)31. Missouri6.6%4.3% (45)0.6% (64)4,009 (9)3,730 (10)32. Delaware6.8%3.7% (26)0.4% (23)1,571 (83)966 (114)33. Louisiana Tech6.9%4.6% (64)1.1% (112)1,515 (86)1,847 (71)34. Northwestern6.9%3.7% (25)0.3% (19)1,150 (106)1,046 (111)35. Arkansas State6.9%4.1% (40)0.5% (42)2,654 (42)1,895 (69)36. Oklahoma6.9%4.4% (56)0.7% (81)3,781 (12)2,870 (29)37. Middle Tennessee6.9%4.6% (65)0.5% (44)927 (119)548 (129)38. Texas A&M7.0%4.8% (70)0.6% (56)3,200 (32)2,361 (47)39. Louisiana7.0%4.3% (51)0.6% (70)2,508 (50)2,492 (43)40. BYU7.0%4.1% (39)0.6% (49)2,493 (51)2,510 (39)41. Duke7.0%4.0% (37)0.5% (35)3,216 (31)2,719 (33)42. Fresno State7.1%4.4% (57)0.9% (99)1,489 (89)1,484 (85)43. Nevada7.1%3.1% (6)0.3% (10)1,732 (75)1,785 (73)44. Kentucky7.2%4.2% (43)0.5% (39)3,671 (18)3,267 (14)45. Louisville7.2%4.3% (53)0.6% (67)4,755 (4)3,559 (11)46. Texas State7.2%5.1% (82)0.9% (104)955 (115)1,067 (108)47. Florida Atlantic7.2%3.5% (23)0.4% (21)1,384 (93)727 (123)48. Virginia7.3%4.2% (42)0.6% (59)6,284 (1)5,170 (1)49. East Carolina7.3%3.4% (14)0.5% (33)1,242 (101)1,233 (98)50. California7.4%4.2% (44)0.6% (57)4,678 (6)3,358 (13)51. San Diego State7.4%4.3% (52)0.7% (84)1,503 (87)1,777 (75)52. Marshall7.4%4.5% (59)0.4% (25)1,550 (84)1,898 (68)53. UNLV7.4%4.3% (50)0.6% (52)2,627 (47)2,154 (54)54. Wisconsin7.5%4.9% (77)0.8% (92)1,245 (100)1,304 (95)55. Boston College7.5%4.4% (55)0.6% (53)1,751 (74)1,556 (81)56. Illinois7.6%4.7% (67)0.5% (40)2,300 (57)2,154 (54)57. Notre Dame7.6%4.3% (48)0.5% (36)2,009 (67)2,320 (50)58. Florida State7.6%4.5% (60)0.8% (93)3,575 (24)3,103 (21)59. South Carolina7.7%4.8% (75)0.7% (80)5,515 (2)4,489 (3)60. Tulsa7.7%4.8% (72)0.6% (65)2,244 (61)2,231 (52)61. Ohio State7.7%4.2% (41)0.5% (46)3,111 (33)2,981 (25)62. South Florida7.8%4.7% (68)0.7% (77)2,950 (38)2,392 (45)63. Liberty7.8%4.3% (46)0.5% (31)1,940 (69)2,504 (40)64. App State7.8%4.0% (38)0.9% (100)1,136 (109)917 (117)65. Syracuse7.9%4.3% (47)0.4% (28)1,682 (78)1,544 (83)66. Oklahoma State7.9%4.6% (62)0.6% (62)4,693 (5)3,812 (8)67. Navy8.0%4.5% (61)0.3% (16)929 (118)2,641 (34)68. UCF8.0%4.8% (73)0.8% (85)2,260 (60)1,929 (65)69. Auburn8.0%5.0% (80)0.9% (101)3,589 (23)3,217 (16)70. James Madison8.1%5.1% (81)0.6% (72)1,402 (91)1,418 (90)71. Arizona8.1%4.3% (49)0.5% (34)2,442 (54)1,780 (74)72. NC State8.1%4.6% (66)0.5% (43)2,646 (44)2,137 (58)73. San Jose State8.1%3.7% (28)0.1% (3)1,379 (94)706 (125)74. Mississippi State8.1%5.2% (84)1.0% (107)2,178 (62)1,694 (79)75. Western Michigan8.1%4.4% (54)1.0% (106)1,143 (107)1,775 (76)76. New Mexico8.2%4.7% (69)1.1% (111)1,685 (77)1,701 (78)77. Florida8.2%5.6% (97)0.5% (45)2,577 (49)2,495 (42)78. FIU8.2%5.3% (89)0.7% (79)1,273 (99)1,459 (86)79. Akron8.3%4.8% (71)0.6% (74)1,232 (103)989 (112)80. Kansas State8.4%3.7% (27)0.3% (13)1,677 (79)1,573 (80)81. Clemson8.5%5.3% (86)0.6% (50)2,121 (65)1,733 (77)82. Rutgers8.6%4.6% (63)0.6% (63)3,070 (34)2,876 (28)83. Temple8.7%5.0% (79)0.6% (66)3,350 (29)2,548 (38)84. Washington8.8%5.4% (94)0.8% (89)3,689 (15)2,816 (30)85. Nebraska8.8%5.4% (92)0.9% (103)4,496 (8)3,847 (7)86. Michigan8.8%5.9% (105)0.6% (71)1,718 (76)1,906 (66)87. Pittsburgh8.8%5.3% (87)0.9% (97)5,165 (3)3,127 (20)88. Georgia Southern8.9%6.1% (111)1.0% (108)1,826 (70)1,375 (94)89. Hawaii8.9%4.4% (58)0.8% (90)1,778 (72)903 (118)90. Alabama9.0%5.5% (96)1.1% (110)1,414 (90)1,090 (106)91. Ball State9.0%6.0% (107)1.5% (119)1,238 (102)1,133 (103)92. Michigan State9.1%5.7% (98)0.8% (95)2,960 (37)2,151 (57)93. Miami (Ohio)9.1%5.2% (83)0.9% (98)2,651 (43)3,004 (24)94. Memphis9.2%5.7% (99)1.1% (109)3,396 (28)3,051 (22)95. UCLA9.3%5.4% (93)0.7% (78)4,583 (7)4,165 (5)96. USC9.3%4.9% (76)0.3% (12)3,048 (36)2,434 (44)97. Baylor9.3%6.0% (110)0.8% (86)3,860 (10)3,192 (17)98. Western Kentucky9.3%5.0% (78)1.0% (105)2,630 (45)1,972 (63)99. Purdue9.3%5.4% (91)0.7% (75)2,297 (58)1,903 (67)100. Tulane9.3%5.9% (102)0.6% (58)1,658 (80)1,441 (88)101. Kent State9.5%5.4% (95)1.4% (117)1,323 (97)1,222 (100)102. Boise State9.6%5.3% (88)0.6% (68)2,364 (56)2,332 (49)103. Kansas9.7%5.9% (103)0.6% (60)2,458 (53)2,105 (60)104. Georgia State9.8%5.3% (85)0.4% (20)2,280 (59)1,549 (82)105. Charlotte9.9%6.0% (108)1.5% (120)850 (122)799 (121)106. UMass10.0%6.7% (115)1.2% (113)1,083 (113)697 (126)107. Arizona State10.0%5.8% (100)0.7% (83)1,653 (81)1,444 (87)108. Colorado10.1%6.0% (109)0.8% (87)3,847 (11)3,260 (15)109. Virginia Tech10.2%6.1% (113)0.8% (96)3,061 (35)3,155 (18)110. Iowa State10.4%5.3% (90)0.6% (69)786 (123)709 (124)111. Georgia Tech10.6%6.0% (106)0.6% (61)2,613 (48)2,364 (46)112. Central Michigan10.9%5.8% (101)0.8% (88)1,784 (71)2,626 (35)113. Stanford11.3%6.6% (114)0.9% (102)3,446 (27)2,503 (41)114. Washington State11.4%6.1% (112)0.8% (91)1,523 (85)1,299 (96)115. Kennesaw State11.4%5.9% (104)0.5% (32)2,730 (41)1,981 (62)116. Troy11.5%6.8% (116)1.2% (115)2,145 (63)1,839 (72)117. Coastal Carolina12.0%7.6% (119)1.3% (116)1,343 (95)1,121 (105)118. Toledo12.1%8.0% (120)0.8% (94)1,340 (96)1,217 (101)119. Wyoming13.5%7.2% (118)1.2% (114)1,491 (88)1,440 (89)120. Oregon State13.7%7.0% (117)1.4% (117)1,176 (105)1,055 (110)Air Forcen/an/an/a559 (128)1,935 (64)Bowling Greenn/an/an/a283 (133)462 (130)Buffalon/an/an/a416 (131)458 (131)Colorado Staten/an/an/a435 (130)307 (132)Eastern Michigann/an/an/a954 (116)831 (120)Missouri Staten/an/an/a387 (132)288 (133)North Dakota Staten/an/an/a0 (137)4 (138)North Carolinan/an/an/a700 (126)592 (127)North Texasn/an/an/a1,632 (82)1,379 (93)Northern Illinoisn/an/an/a461 (129)792 (122)Ohion/an/an/a42 (136)167 (134)Old Dominionn/an/an/a82 (135)138 (135)Sacramento Staten/an/an/a0 (137)6 (137)Sam Houstonn/an/an/a734 (124)564 (128)South Alabaman/an/an/a1,105 (111)1,227 (99)Southern Missn/an/an/a1,142 (108)938 (116)Utahn/an/an/a585 (127)1,070 (107)UTEPn/an/an/a113 (134)103 (136)Oregon sits in a category of its own, leading all qualified teams in each of the three pass protection rates. The only caveat is experience depth, as the roster just meets the minimum requirement of three offensive linemen with 100-plus FBS pass-block snaps.
Iowa is even more concentrated from a sample perspective. The Hawkeyes also qualify with just three linemen above 100 pass-block snaps, and none of them exceed 400. That shouldn't invalidate the performance, though. It just means the efficiency is coming from a relatively tight band of reps.
What becomes interesting across the broader table is that while some of the least experienced qualifying offensive line groups still post strong pass protection rates, several of the most heavily used units sit firmly in the middle or even lower half of the rankings. In other words, more pass-blocking exposure doesn't automatically translate into cleaner protection on a per-snap basis.
Indiana is somewhat of an outlier that blends both. The Hoosiers are the only team to rank in the top 15 in total pass-block snaps while also near the top of the table in lowest pass-block lost rate, showing that high volume and strong pass protection can align when the unit is both deep and technically sound.
So, where do the most battle-tested offensive lines fall? Here's where the Power Four teams with the highest pass-block snap totals land in the lowest pass-block lost rate:
- Virginia — 7.3% (48th)
- South Carolina — 7.7% (59th)
- Pittsburgh — 8.8% (87th)
- Louisville — 7.2% (45th)
- Oklahoma State — 7.9% (66th)
Putting it all together
When you take all these production and efficiency numbers together, they help paint a clearer picture of which offenses are best positioned to enter 2026. But that's only one side of the ball. Next week, we turn to the defense, looking at tackles, pressures, sacks and coverage efficiency to find out which rosters are actually built to stop them.
Add CBS Sports on Google Join the Conversation comments